

Cash flow monitoring is the discipline of tracking actual money in and out of your business continuously, so a shrinking bank balance never catches you by surprise. The fix that separates businesses that survive from those that don't is simple to state and hard to skip: run a 15-minute weekly KPI review alongside a 13-week rolling forecast. Only about one in three small businesses survives past seven years, and cash shortfalls are a recurring cause. Specialized advisory firms help build that system instead of guessing at it.
TL;DR:
- Regular weekly KPI reviews should focus on cash balance after committed outflows and weeks of runway to catch shortfalls early.
- Automating data collection and transaction tagging ensures accurate real-time cash view, while human oversight handles reclassifications and exceptions.
- Escalation rules for red flags must be predefined during calm periods to enable swift, effective responses during crises.
- Building a simple, live-dashboard centered on six key metrics allows fast assessment of cash health and risk, with daily checks during peak periods.
- Implementing a 13-week rolling forecast and weekly review routine can be established quickly through targeted, one-off projects or team training.
Table of Contents
- What Does Cash Flow Monitoring Actually Cover?
- How Do You Set Up a Monitoring Process?
- Which KPIs Actually Matter for Cash Flow?
- What Should a One-Page Cash Flow Dashboard Include?
- What Should You Automate, and Where Does a Human Need to Sign Off?
- What Do You Do When a KPI Hits Red?
- How Byram Advisory Builds This in Practice
- Why Weekly Beats Monthly for Cash Flow
- Get a Weekly Cash Flow System Running in Days, Not Months
- Sources
- FAQ
What Does Cash Flow Monitoring Actually Cover?
Cash flow monitoring tracks money as it actually moves, not as accounting rules recognize it. A client who owes you $40,000 on a 60-day invoice shows up as revenue on your profit and loss statement today. It shows up in your bank account in two months, if at all. That gap between profit and cash is exactly what monitoring is built to catch, and distinguishing operating, investing, and financing cash flows helps you see whether a shortfall is structural or just timing.
Effective monitoring pulls from five data sources:
- Bank feeds, for the actual cash position right now
- The general ledger, for categorized transaction history
- Accounts receivable, for what customers owe and when
- Accounts payable, for what you owe and when it's due
- Payroll, for the largest recurring outflow most businesses carry
Watch these on three horizons: daily cash position during tight or peak periods, a weekly KPI check the rest of the time, and a full monthly close for variance analysis.
How Do You Set Up a Monitoring Process?
A repeatable process beats a one-time spreadsheet exercise every time. Here's the sequence that holds up over multiple quarters, not just the first month you build it.
- Collect. Connect your bank feeds, GL, AR, and AP systems so data flows in automatically instead of getting re-entered by hand each week.
- Structure. Categorize every transaction and map it into forecasting buckets. Operating inflows, committed outflows, discretionary spend. This is where messy data gets fixed once instead of every week.
- Analyze. Calculate your weekly KPIs and reconcile forecast against actual. Weekly reconciliation against bank actuals is what keeps a 13-week forecast honest instead of decorative.
- Act. Predefine your trigger thresholds, assign an owner to each one, and set escalation rules before you need them, not during the crisis.
Pro Tip: Build your escalation rules on a calm Tuesday, not the week you're staring at a negative cash position. Decisions made in advance are decisions, not panic.
The step most businesses skip is step four. They collect and analyze data beautifully and then freeze when a number turns red because nobody decided in advance who does what.
Which KPIs Actually Matter for Cash Flow?
Six metrics carry most of the signal, and a focused weekly review of these six takes roughly 15 minutes.
- Cash balance after committed outflows. Your bank balance minus payroll, rent, and anything already scheduled to leave. This is your real number, not the one on the screen.
- Weeks of runway. Available cash divided by average weekly net burn. Track the trend, not just the current figure.
- Net cash burn vs. plan. Actual burn against your forecast burn for the same period. A widening gap here is your earliest warning sign.
- AR aging (Days Sales Outstanding). How long, on average, customers take to pay. Rising DSO often means collections are slipping, not that revenue is.
- AP aging (Days Payable Outstanding). How long you're taking to pay vendors. Useful as a lever, dangerous as a habit.
- Inventory dollars on hand and cash conversion cycle (CCC) trend. Cash tied up in stock plus DSO minus DPO tells you how long a dollar is locked away before it comes back as cash.
Runway is the metric people compute wrong most often. Base it on cash actually available today, not on a hoped-for collection that hasn't landed yet.
What Should a One-Page Cash Flow Dashboard Include?
A single page answers three questions: where are you, where are you headed, and where's the risk. A dashboard built around live feeds and a small KPI set does this without forcing anyone to open six separate reports.
Build it with:
- KPI cards for cash after committed outflows, weeks of runway, and net burn
- A line chart tracking the 13-week rolling forecast against actuals
- A waterfall chart showing period-over-period cash movement
- Variance overlays highlighting forecast-vs-actual gaps by category
- An AR/AP aging summary and a CCC trend line
On cadence, The Hartford recommends daily position checks during peak periods, a weekly KPI review the rest of the year, and a monthly deep dive that rolls your 13-week forecast forward another week. That rhythm is what keeps the dashboard from turning into a report nobody opens.
What Should You Automate, and Where Does a Human Need to Sign Off?
Five tool categories cover most of the stack: bank aggregation, AR automation, AP scheduling, forecast engines, and dashboards that tie it together.
Automate the repetitive parts:
- Auto-tagging transactions as they hit the bank feed
- Live syncing between bank, GL, AR, and AP so numbers never go stale
- Forecast self-correction that adjusts the 13-week model as actuals come in
- Threshold alerts that fire the moment a KPI crosses red
Keep a human in the loop for anything that changes a payment, reclassifies a disputed transaction, or overrides a forecast assumption. Automation should flag; a person should decide.
When selecting tools, prioritize GL/ERP connectors, especially direct QuickBooks integration, along with a clear audit trail, role-based access, and documented data lineage.
Pro Tip: If your forecasting tool can't show you which bank transaction fed which line item, you don't have a governed model. You have a spreadsheet with better formatting.
What Do You Do When a KPI Hits Red?
Pre-decided actions beat improvised ones every time a threshold trips.
- Triage immediately. Freeze discretionary spend, push a targeted collections effort on your largest overdue invoices, and confirm payroll is protected before anything else moves. Owner: controller or fractional CFO.
- Pull a short-term lever. Accelerate AR with early-payment discounts, negotiate extended terms with a key vendor, trim slow-moving inventory, or draw a pre-arranged line of credit. Match the lever to the KPI that's actually red.
- Escalate on a timeline. If runway stays under 8 weeks after one review cycle, alert ownership and request a decision on financing or cost cuts within 48 hours, not at the next monthly meeting.
How Byram Advisory Builds This in Practice
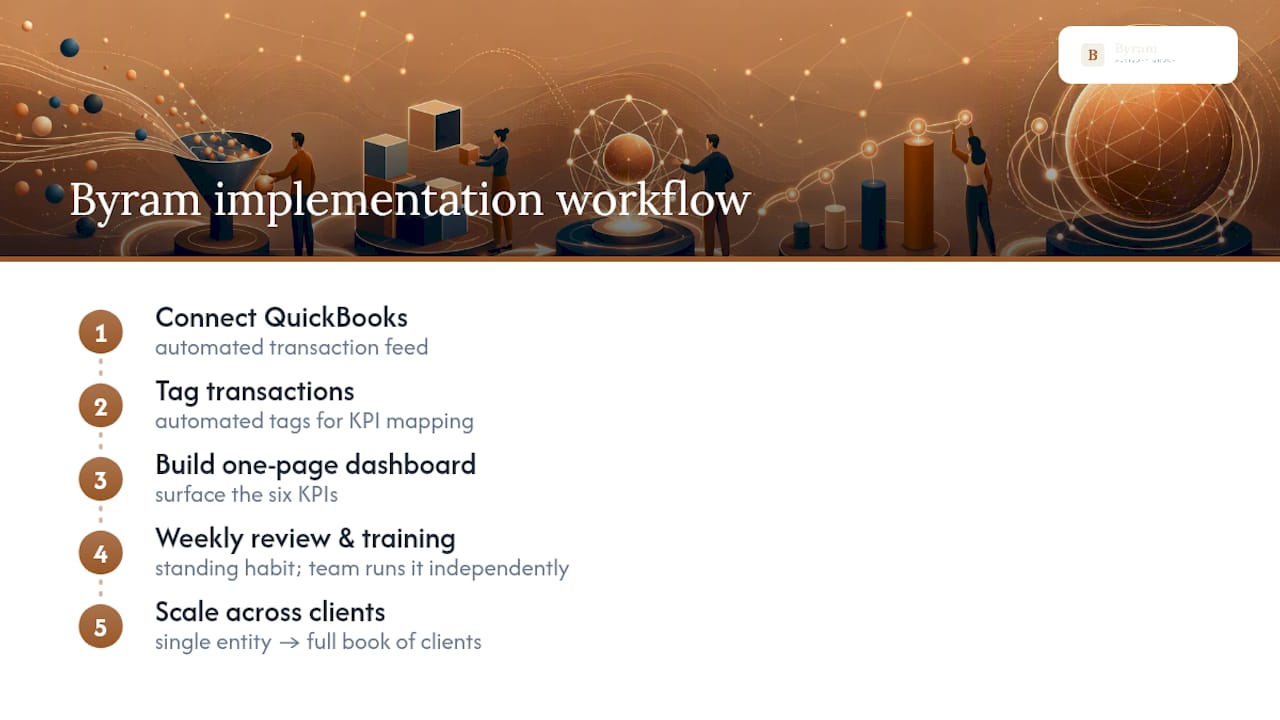
Byram Advisory implements this exact system for fractional CFOs and accounting teams. The typical path connects QuickBooks to automated transaction tagging, builds the one-page dashboard around the six KPIs above, and installs the weekly review as a standing habit, backed by hands-on training so the team can run it independently. Clients get consistent reporting, an audit-ready trail behind every number, and hours back each month that used to go into manual reconciliation. For teams exploring the same AI-first automation patterns more broadly, the approach scales from a single entity to a full book of clients.
Why Weekly Beats Monthly for Cash Flow
Monthly close tells you what already happened. A weekly KPI review catches the slide while you still have room to steer. Named ownership on each threshold turns a scary number into a task somebody actually does, and five small corrections beat one large, reactive cut every time. That's the whole argument for the cadence.
— Owen
Get a Weekly Cash Flow System Running in Days, Not Months
Most firms trying to fix cash flow visibility end up choosing between a generic dashboard template that never quite fits their chart of accounts, or a full BI platform overkill for a ten-person firm. The Sprint is a one-off engagement that provides a QuickBooks-connected dashboard, six-KPI tracking, and a 13-week rolling forecast designed to go live quickly, without a long build cycle or vendor lock-in issues afterward.
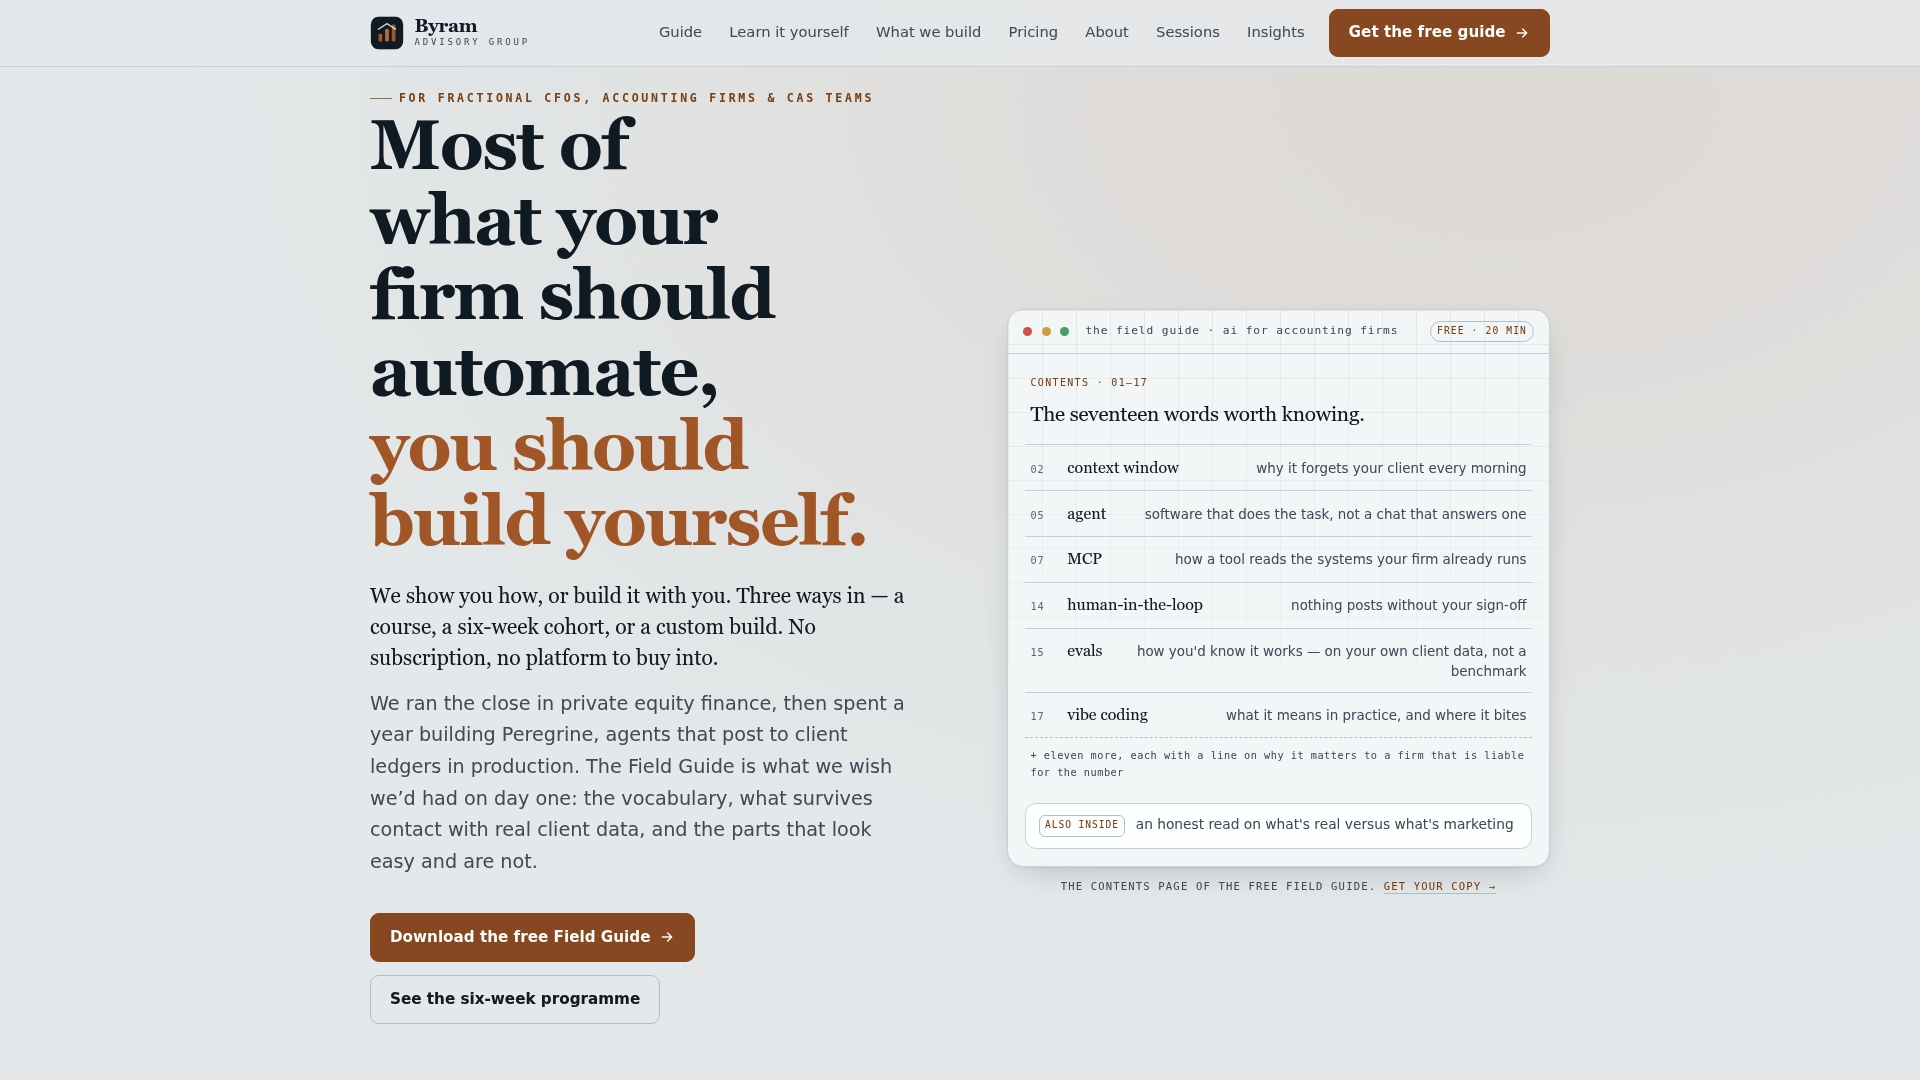
If you'd rather train your team to run this system themselves, The Bootcamp is hands-on cohort training built for exactly that. And if you want the framework before committing to either, download The Field Guide to AI for Accounting Firms first. For readers thinking beyond weekly monitoring into longer-term financial planning, this overview of high-income planning mistakes is worth a read too. Whichever entry point fits, the next step is the same: get your cash data connected and your first weekly review scheduled this month.
Sources
The BLS survivorship data behind this article's opening claim comes from its 2024 business establishment analysis. Cadence guidance draws on The Hartford's monitoring framework, KPI structure on Eightx's weekly review model, forecasting mechanics on Cube's 13-week rolling approach, dashboard design on Sigma's build guide, and foundational cash flow definitions on Investopedia.
This article is general information, not a substitute for advice from a qualified financial advisor. Consult a qualified financial professional about your own circumstances before acting on anything here.
- Bureau of Labor Statistics analysis — business survivorship (2024)
- Understand the importance of cash flow and monitor it — The Hartford
- The cash flow KPIs every CEO should watch weekly — Eightx (blog)
- Cash flow forecasting: Know your cash position — Cube
FAQ
What Is Monitoring Cash Flow?
Monitoring cash flow means tracking actual money moving in and out of a business on a regular schedule, rather than relying on profit figures that lag real bank activity. It typically combines a daily or weekly cash position check with a rolling forecast, so shortfalls show up weeks before they become urgent.
What Are the Three Types of Cash Flow Analysis?
Cash flow analysis breaks into operating, investing, and financing cash flows. Operating covers day-to-day business activity, investing covers asset purchases and sales, and financing covers debt and equity movement, and separating the three helps you see whether a cash problem is structural or just timing.
How Often Should I Review My Cash Flow KPIs?
Review your core KPIs weekly, with daily position checks during peak or tight periods and a deeper monthly variance analysis. A focused weekly review of six KPIs takes about 15 minutes once your dashboard is built.
What Does Byram Advisory Charge to Set This Up?
Byram Advisory's fast implementation option, The Sprint, is a 2000 USD one-off engagement. Pricing for The Bootcamp and custom build engagements is available directly on the Byram Advisory site.
What's the Difference Between a 13-Week Forecast and a Monthly Budget?
A 13-week rolling forecast tracks cash week by week and rolls forward continuously, reconciled against bank actuals. A monthly budget is a fixed-period plan reviewed less often and typically built around accounting categories rather than actual cash timing.