

A quality of earnings checklist proves which portion of reported earnings is durable, defensible, and backed by cash. It produces the specific outputs buyers, sellers, and lenders actually rely on to close a deal: an adjusted-EBITDA bridge, a proof-of-cash reconciliation, and a working capital peg. Success means every adjustment survives scrutiny, cash and accrual books tie out, and the peg holds up when tested against a roll-forward.
TL;DR:
- A thorough QoE process requires detailed cash and ledger reconciliation, not just identifying the highest EBITDA figure.
- Revenue testing involves verifying recognition policies, sampling invoices, and flagging revenue concentration or channel stuffing risks.
- Only adjustments supported by clear documentation—such as third-party salary data or invoices—can survive buyer scrutiny in EBITDA adjustments.
- Correctly setting working capital and the peg relies on a look-back period, seasonality adjustments, and agreed-upon baseline metrics.
- Automating reconciliation processes with platforms like Peregrine can significantly reduce preparation time and improve data traceability for deal readiness.
Table of Contents
- What Belongs on a Quality of Earnings Checklist
- Revenue Quality: Concrete Tests and the Evidence to Collect
- EBITDA Adjustments: Categories, Defensibility, and Common Pitfalls
- Working Capital: Normalization and Setting the Peg
- Proof of Cash: What It Reconciles and What It Reveals
- Balance Sheet Checks and the Ratios That Matter
- General Ledger Review and Anomaly Testing
- Risk Flags and Immediate Validation Steps
- Deliverables: What a Defensible QoE Package Includes
- Where Automation Cuts QoE Prep Time
- Analysis of Cost Structure and Margin Sustainability
- Impact of Accounting Policies and Changes
- Cross-Period Comparison and Trend Analysis
- Off-Balance Sheet Liabilities and Contingencies
- A Final Word on QoE Discipline
- How Byram Advisory Helps Teams Build QoE-Ready Financials
- Sources
- FAQ
What Belongs on a Quality of Earnings Checklist
A working quality of earnings checklist runs through several checkpoints, and the deal teams who use them well treat data collection as step one, not an afterthought. Grant Thornton frames quality of earnings analysis as a test of whether reported earnings are durable and cash backed, not a hunt for the highest possible EBITDA number.
Before the analysis starts, gather:
- Trial balance and full general ledger detail for the look-back period
- Bank statements covering the same period as the general ledger
- AR and AP aging schedules
- Payroll registers and any related-party payment records
- Customer and vendor contracts, especially anything with unusual terms
From there, the checklist splits into six analytical pillars: revenue quality, EBITDA adjustments, working capital, proof-of-cash, general ledger anomaly testing, and balance sheet review. A common structure groups these into eight sections that also cover data requests, risk flags, and final deliverables. Expect outputs in both PDF narrative form and Excel workbooks that a lender or valuation team can trace line by line.
Revenue Quality: Concrete Tests and the Evidence to Collect
Revenue quality testing starts with the recognition policy itself. Pull the written policy, then test cut-off at period end. Sample a handful of invoices and trace each one back to a signed contract and an actual cash receipt in the bank statement. If the paper trail breaks anywhere in that chain, the revenue behind it is suspect.
- Confirm the revenue recognition policy matches how invoices are actually booked
- Sample invoices against contracts and cash receipts, not just the GL entry
- Separate recurring revenue from one-off project or spot sales
- Flag any customer above 10% of total revenue for concentration risk
- Review deferred revenue balances, refund patterns, rebate accruals, and backlog convertibility
Channel stuffing (pushing product to distributors near period end to inflate short-term revenue) shows up as a spike in shipments followed by a wave of returns the next quarter. Watch for that pattern specifically around fiscal year-end.
Pro Tip: Pull AR aging for an extended period side by side with monthly revenue. If days sales outstanding creeps up while revenue looks flat or growing, someone may be booking sales before cash is collectible.
EBITDA Adjustments: Categories, Defensibility, and Common Pitfalls
Not every add-back survives a buyer's scrutiny. The ones that do share one trait: clean paper supporting them.
- Owner compensation normalization: compare the owner's pay to market rate for an equivalent hire, and document the gap with third-party salary data
- Related-party expenses: isolate any payments to entities the owner controls, and test whether pricing was at arm's length
- Non-recurring items: require an invoice, board minute, or engagement letter proving the cost truly will not repeat
- Pro forma adjustments: for recent acquisitions or divestitures, build a run-rate that reflects the current business, not the historical mix
The pitfall that sinks the most deals is stacking add-backs without separating economic substance from wishful thinking. A defensible QoE report documents an adjusted-EBITDA bridge that a skeptical buyer can walk through line by line and still agree with.
Working Capital: Normalization and Setting the Peg
Working capital disputes kill more deals at the eleventh hour than almost any other line item. Getting the peg right up front avoids that fight.
- Define the components in scope: accounts receivable, inventory, prepaid expenses, accounts payable, and accrued liabilities. Exclude non-operating items like intercompany loans or owner distributions.
- Choose a look-back period, typically 12 to 24 months, and adjust for seasonality if the business has a predictable annual swing.
- Calculate a normalized average and propose it as the peg, then stress-test it against a roll-forward from signing to close.
- Expect negotiation: buyers often push for a higher peg to protect cash at close, while sellers argue for a lower one based on a specific low season in the look-back window.
When the peg gets disputed, the resolution usually lands on a blended average that both sides can defend with the same underlying schedule.
Proof of Cash: What It Reconciles and What It Reveals
Proof of cash reconciles every deposit, disbursement, and internal transfer in the bank statements against the general ledger for the same period. It is the single test that most reliably separates real earnings from reported ones, because it directly checks whether revenue on paper ever became cash in the bank.
- Reconcile every bank deposit to a corresponding GL revenue entry
- Trace disbursements to vendor invoices and payroll records
- Flag transfers to related parties that lack a clear business purpose
- Watch for personal expenses routed through the business account
A clean proof-of-cash package is what makes an adjusted-EBITDA bridge credible to a lender, not just to the seller's own accountant.
Balance Sheet Checks and the Ratios That Matter
The balance sheet often hides what the income statement smooths over. Inventory valuation method, deferred revenue treatment, and any off-balance-sheet lease commitments can all shift reported earnings without touching the P&L directly.
- Confirm the inventory valuation method (FIFO, LIFO, weighted average) and whether it changed recently
- Check deferred revenue for proper cutoff and matching to service delivery
- Identify any operating leases with capitalization implications
- Calculate debt-to-EBITDA, interest coverage, days sales outstanding, and inventory turns across at least three periods
The CFA Institute's framework for evaluating earnings quality treats these ratio trends as a proxy for whether earnings come from repeatable operations or from accounting choices. A DSO that climbs three periods running, even with flat revenue, tells a buyer something the income statement never will.
General Ledger Review and Anomaly Testing
Full general ledger anomaly testing is increasingly standard; comprehensive automated testing identifies more issues than limited sampling.
- Scan the entire GL for round-dollar entries, a common signature of manual adjustments rather than system-generated transactions
- Flag manual journal entries booked outside normal operating cycles, especially near period-end
- Search for duplicate entries and reversed-then-rebooked transactions
- Check for clustering of adjustments in the final days of each reporting period
Automated, full-population scans surface red flags that a 5% sample simply misses, and forensic scoring approaches built on multi-point checks across revenue, cash flow, and balance sheet data work on the same principle: coverage beats sampling.
Pro Tip: Any flagged transaction needs three things before it gets waved through: a supporting invoice, an approval trail, and a matching bank record. Missing any one of the three, treat it as unresolved.
Risk Flags and Immediate Validation Steps
Some red flags matter more than others, and a deal team needs to know which ones to chase first.
- A single customer contributing a significant revenue portion with no long-term contract
- Add-backs with no invoice, engagement letter, or board record behind them
- Declining cash conversion despite stable or growing reported revenue
Triage starts with proof-of-cash on the specific accounts tied to the flag, followed by a direct vendor or customer confirmation where the paper trail is thin. Deals rarely die outright over these findings. More often they end in a holdback, an escrow, a price re-trade, or a short extension of due diligence to clear the specific item.
Deliverables: What a Defensible QoE Package Includes
A complete package gives every stakeholder a document built for their purpose.
- A lender-ready PDF narrative summarizing findings and methodology
- Excel workbooks with full traceability back to GL detail
- An adjusted-EBITDA bridge showing each adjustment and its supporting basis
- A working capital schedule with the proposed peg and roll-forward mechanics
- A proof-of-cash workbook tying bank activity to GL entries
Before anything goes out the door, every schedule needs a sign-off check confirming it traces cleanly to source documents. Lenders and valuation teams increasingly reject or re-scope QoE reports that arrive without that traceability built in.
Where Automation Cuts QoE Prep Time
Automation platforms like Peregrine can pull QuickBooks exports directly into templated reconciliations, cutting the manual copy-paste work out of proof-of-cash and GL scans. Full-GL anomaly testing, standardized export templates, and repeatable proof-of-cash steps mean fewer rounds of back-and-forth with a buyer's diligence team, and adjustments that hold up because the same automated process produced them every time.
Analysis of Cost Structure and Margin Sustainability
Margin trends tell a buyer more about earnings quality than a single EBITDA number ever will. A business posting flat revenue with expanding gross margin is doing something structurally different than one holding margin steady only because a key input cost happened to fall for two quarters.
Break the cost structure into fixed and variable components first. A cost base that is mostly fixed means margin swings hard with volume, which raises the stakes on any revenue concentration risk already flagged earlier in the checklist. A mostly variable cost base tends to protect margin better in a downturn but usually caps upside in a growth scenario.
Then look at the direction of key cost categories relative to revenue over at least three to four periods. Cost of goods sold creeping up faster than revenue, even slightly, usually means either pricing power is eroding or input costs are rising faster than the company can pass through. Labor costs deserve the same scrutiny, particularly in service businesses where headcount additions often precede the revenue they are meant to support by a quarter or two.
Sustainable margin comes from pricing discipline, supplier terms that hold steady, and a cost base that scales sensibly with volume. Margin that looks strong only due to one-off vendor rebates, temporary staffing gaps, or favorable non-repeatable input prices belongs back in the EBITDA adjustments section, not in the base case a buyer uses to underwrite the deal.
Impact of Accounting Policies and Changes
Any accounting policy change inside the look-back period deserves a hard look, because a policy switch can move reported earnings without a single dollar of actual cash changing hands.
Revenue recognition timing is the most common offender. A company that shifts from recognizing revenue at shipment to recognizing it at delivery, or changes how it treats multi-element contracts, can shift hundreds of thousands of dollars of revenue between periods purely through the policy change itself. The same applies to depreciation method changes, useful life extensions on fixed assets, and shifts in how bad debt reserves get calculated.
Compare the policy in place at the start of the look-back period against the policy in place today. If anything changed, quantify the earnings impact of the change alone, isolated from actual operating performance. A useful life extension on equipment, for instance, immediately reduces depreciation expense and inflates reported earnings, even though nothing about the underlying business improved.
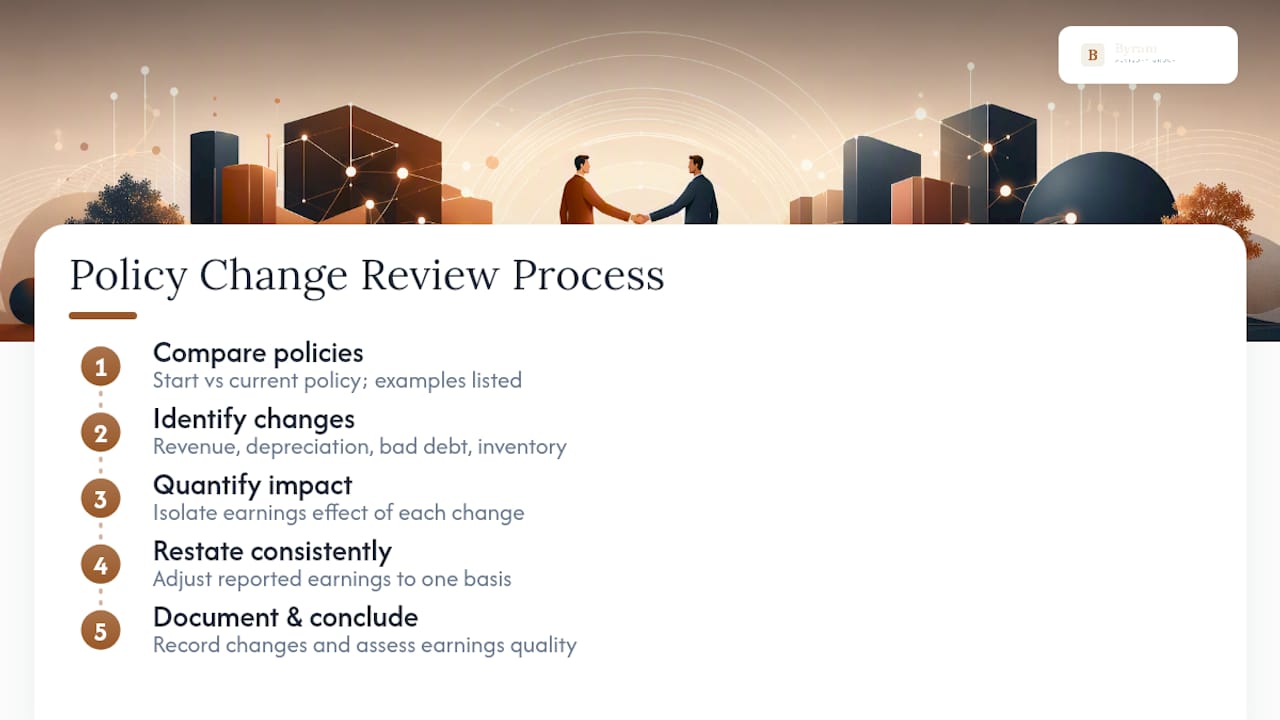
Inventory costing method changes deserve the same treatment. A switch from LIFO to weighted average, or vice versa, changes reported cost of goods sold and therefore gross margin, independent of any change in actual purchasing or sales activity. Document every policy change found in the look-back window, and adjust reported earnings back to a consistent basis before drawing any conclusion about trend or trajectory. Earnings quality, per the CFA Institute's framework, depends on repeatable economic performance. A policy change is neither repeatable nor economic.
Cross-Period Comparison and Trend Analysis
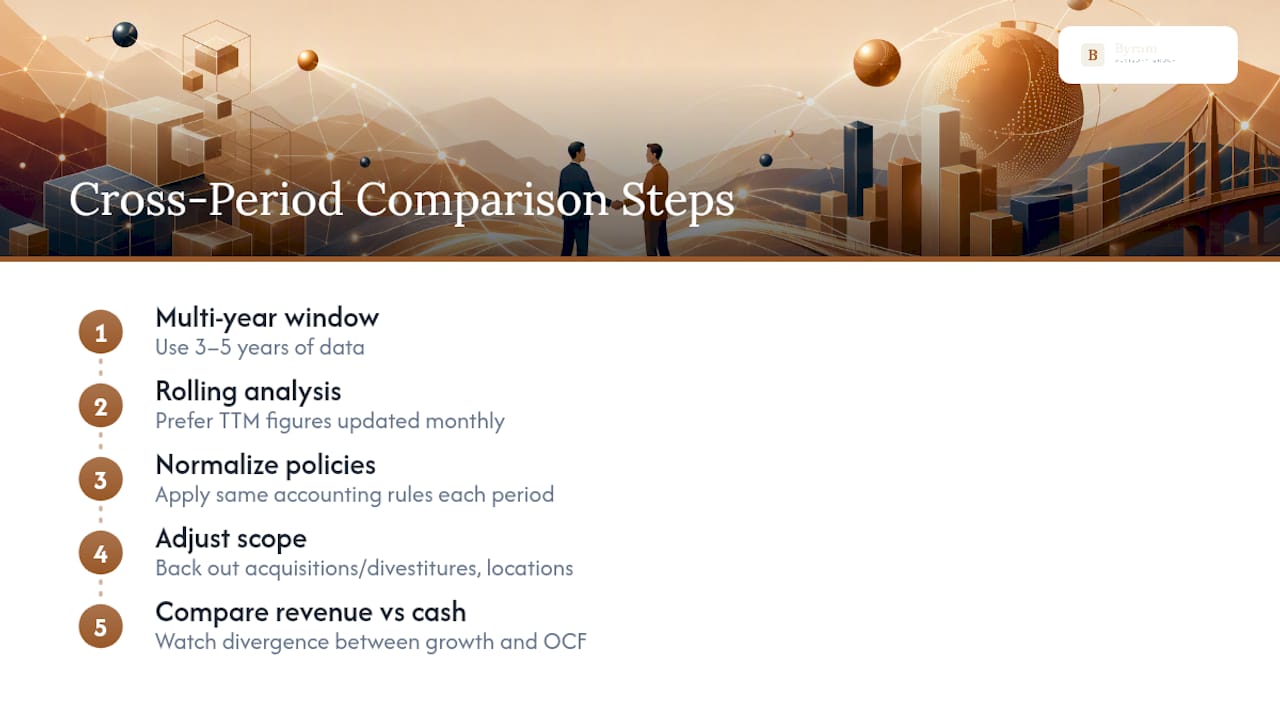
A single period of clean numbers proves very little. The real test is whether revenue, margin, and cash conversion tell a consistent story across at least three to five years, or whether one strong year is doing all the heavy lifting for the whole valuation case.
Build the comparison on a rolling basis rather than year-over-year snapshots alone. Trailing twelve-month figures updated monthly reveal inflection points that annual comparisons smooth over completely. A business that looks flat on a calendar-year basis might actually be accelerating in the back half, or decelerating right as the deal is signed, and only a rolling view catches that in time.
Normalize every period on the same basis before comparing them. That means applying the same accounting policies across all periods (see the point above), backing out the same categories of one-time items each year, and adjusting for any acquisitions or divestitures so each period reflects a comparable scope of business. Comparing a five-location business in 2024 against a three-location business in 2022 without adjustment tells a buyer nothing useful.
Watch specifically for divergence between revenue growth and cash conversion. A company growing revenue 20% a year while operating cash flow stays flat or declines is often financing that growth through working capital, extended customer terms, or delayed vendor payments. That divergence, more than almost any single ratio, predicts whether reported growth will actually show up in the buyer's bank account after close.
Off-Balance Sheet Liabilities and Contingencies
What is not on the balance sheet can matter as much as what is. Operating leases, pending litigation, warranty obligations, and guarantees extended to related parties or third parties routinely fall outside the reported liability figures, and each one can materially change the economics of a deal once uncovered.
Start with a full lease abstract for every operating lease agreement, not just the major ones. Long-term lease commitments function economically like debt, even when accounting treatment keeps them off the balance sheet, and a buyer needs the total commitment schedule to properly assess leverage and cash obligations post-close.
Pending or threatened litigation needs a direct answer, not an assumption. Request a formal representation from company counsel disclosing any active, threatened, or reasonably anticipated legal matters, along with an estimate of potential exposure. The same applies to warranty reserves. If the reserve balance has stayed flat while sales volume grew, the reserve is very likely understated relative to actual future claims.
Guarantees deserve particular attention in owner-operated businesses, where a company sometimes guarantees a loan for a related entity, or personally guarantees company debt in a way that creates unusual claims on business assets. Any such arrangement should be disclosed and quantified, because it can create liabilities that surface only after the deal closes and the new owner discovers them the hard way.
A Final Word on QoE Discipline
Sellers who assemble this evidence before a buyer asks for it close faster and defend valuation better. Buyers should treat a checklist with gaps as a red flag in itself, not just a formality to complete.
— Owen
How Byram Advisory Helps Teams Build QoE-Ready Financials
Byram-advisory gives fractional CFOs and accounting teams a faster path to the exact evidence a QoE demands, without adding headcount to get there. Rather than rebuilding reconciliations by hand every time a client heads toward a transaction, firms use Peregrine to connect directly to QuickBooks, automate repetitive reconciliation work, and keep a real-time financial picture ready for scrutiny at any point, not just when a buyer shows up.

That readiness is the real advantage: less scrambling when a data request lands, fewer manual errors in the adjustments a buyer will test hardest, and a working capital schedule that already reflects clean, current data instead of a rushed reconstruction. Firms new to this kind of automation can start with the free Field Guide to AI for Accounting Firms for a practical walkthrough, or go deeper with the DIY AI Implementation Course to build these workflows into client accounts directly.
This article is general information, not a substitute for advice from a qualified financial advisor. Consult a qualified financial professional about your own circumstances before acting on anything here.
Sources
- Quality of earnings in M&A transactions — Grant Thornton
- Evaluating quality financial reports — CFA Institute
- Shepi
- Quality of Earnings (QoE) Checklist for M&A Buyers | OGScapital
FAQ
How Do You Check Quality of Earnings?
Check quality of earnings by testing revenue recognition against contracts and cash receipts, reconciling bank activity to the general ledger through proof-of-cash, and confirming that EBITDA add-backs have documented, non-recurring support.
What Is a CDD Checklist?
A customer due diligence (CDD) checklist verifies a business's customers, ownership, and transaction patterns, typically for compliance purposes, and is a distinct process from a quality of earnings checklist, though both feed into full M&A due diligence.
What Is Included in a Quality of Earnings Report?
A quality of earnings report typically includes an adjusted-EBITDA bridge, revenue and margin analytics, a working capital roll-forward, a proof-of-cash reconciliation, and supporting Excel workbooks alongside a narrative PDF.
Can You Give an Example of a Quality of Earnings Report?
A typical example shows reported EBITDA of, say, $2 million adjusted upward or downward through itemized add-backs like owner compensation normalization or a one-time legal settlement, arriving at a normalized adjusted EBITDA supported by a proof-of-cash reconciliation and working capital schedule.
Can Automation Help Prepare QoE Evidence Faster?
Yes. Tools that connect directly to accounting platforms like QuickBooks can run full-GL anomaly scans and standardize reconciliations, which cuts preparation time and produces more consistent, traceable adjustments than manual sampling.