

Real-time P&L reporting gives you an always-current view of income and expenses so you can act on cash, pricing, and staffing decisions as they happen instead of weeks later. This guide walks through what "real-time" really means, the systems that make it possible, a step-by-step rollout plan, and the governance checklist that keeps live numbers defensible when an investor, lender, or auditor asks for proof.
TL;DR:
- Near-real-time transaction syncs from bank feeds and connected apps can reduce P&L updating times from weeks to hours or same-day, improving decision speed.
- Establishing a clear chart of accounts and disciplined data extraction is crucial, as messy categories undermine the reliability of live financial reports.
- Implementing automated reconciliation processes and exception workflows early on prevents errors from cascading and ensures audit-ready, defensible numbers.
- Using separate operational and GAAP-aligned P&L views helps balance decision-making speed with external stakeholder accuracy.
- Investment should be made when month-end surprises start impacting decisions, with careful attention to reconciliation discipline and governance to maintain trust.
Table of Contents
- Why live P&L matters for faster business decisions
- What real-time P&L reporting actually means in practice
- Technical foundations: systems, feeds, and integration patterns
- A step-by-step implementation roadmap for small businesses
- Data governance and controls to make live P&L defensible
- Reporting structures and KPIs to show on live P&L dashboards
- How we build reliable real-time P&L systems for clients
- When to invest in live P&L and traps to avoid
- How Byram Advisory can help you get there
- FAQ
- Sources
Why live P&L matters for faster business decisions
A profit and loss statement that is three or four weeks old tells you what already happened. A live one tells you what is happening now, while you still have room to change course. That difference shows up most clearly in three places: cash planning, hiring, and pricing.
When you can see margin erosion the week it starts, you can raise prices or renegotiate a supplier contract before the damage compounds across a full quarter. When payroll decisions depend on knowing your actual runway, a live cash position beats a stale spreadsheet every time. And when a new product line underperforms, catching it in week two instead of month two saves real money.
Common situations where live P&L changes the outcome:
- Cash crunches: spotting a dip in collections early enough to delay a discretionary purchase instead of scrambling for a short-term loan.
- Supplier sizing: seeing margin compression from a cost increase immediately, so you can adjust order volume before the next invoice.
- Hiring timing: confirming payroll capacity with current numbers rather than a forecast built on last quarter's close.
- Pricing moves: testing a price change and watching the margin impact within days rather than waiting for month-end to confirm it worked.
The pitfalls of lagging reports are familiar to anyone who has run a small business: a client goes quiet for 60 days and the revenue gap only shows up in the month-end close, by which point a hiring decision already happened on outdated assumptions. Real-time reporting does not eliminate every surprise, but it shrinks the window between a problem starting and someone noticing it.
Watch for a few signals that the investment is paying off: fewer "surprise" variances at month-end, forecast updates that take hours instead of days, and finance conversations with leadership that start with current numbers instead of "let me pull that together."
Pro Tip: Track how long it takes to answer "what's our gross margin this month" today. If the honest answer is "I'll get back to you," that gap is your baseline for measuring improvement.
What real-time P&L reporting actually means in practice
"Real-time" is a useful shorthand, but very few small businesses run a P&L that updates by the second, and most do not need to. What matters is that the gap between a transaction happening and it showing up in your report shrinks from weeks to hours or, in many cases, same-day.
Near-real-time refreshes, meaning data that syncs every few hours through bank feeds and connected apps, are the practical standard for most small businesses. Full real-time ledger posting exists in some platforms, but the operational benefit over a well-tuned near-real-time feed is marginal for a business with a handful of entities and a modest transaction volume.
Some parts of the P&L simply cannot move at transaction speed. Accrual adjustments, depreciation schedules, inventory valuation changes, and certain tax provisions still depend on periodic review, usually monthly. A live dashboard can show you an operational estimate of these in near real time, but the adjusted figures only become final once someone reviews them against source documents.
This is why most businesses benefit from running two views side by side:
- Operational P&L: a fast, directional view used for day-to-day decisions like pricing and hiring, refreshed continuously from bank feeds and connected systems.
- GAAP-aligned P&L: the formally adjusted statement used for lenders, investors, and tax filings, finalized at month-end after accruals and reconciliations are complete.
The operational view trades some precision for speed. The GAAP-aligned view trades speed for the accuracy that external stakeholders require. Knowing which one you are looking at, and telling your team which one they are looking at, prevents a lot of confused Monday morning meetings.
Technical foundations: systems, feeds, and integration patterns
Live P&L reporting depends on getting transaction data out of your source systems and into your reporting layer with minimal manual handling. The core data sources almost every small business needs to connect are bank feeds, the general ledger, point-of-sale systems, payroll, and accounts payable or receivable tools.
There are three common integration patterns, in rough order of complexity:
- Native connectors built into your accounting platform, such as bank feed integrations inside QuickBooks, which require the least setup but offer the least flexibility.
- Middleware tools that sit between systems and standardize data before it reaches your reporting layer, useful when you run multiple disconnected apps across entities.
- Direct APIs for custom integrations, typically needed only once transaction volume or system complexity outgrows what native connectors can handle.
For many small businesses, the fastest path to reliable numbers is less about exotic integrations and more about disciplined extraction and transformation of what you already have. Power Query style extract, transform, and load routines, where data is pulled from exports or connectors, cleaned, and standardized before it hits a dashboard, remain a practical bridge when a direct connector does not exist.
None of this works well without a consistent chart of accounts. If one entity categorizes marketing spend differently than another, or if a POS system labels fees in a way that does not map cleanly to your general ledger, your "real-time" report will be real-time garbage. Aligning master data, meaning account names, cost center definitions, and categorization rules, before connecting feeds saves far more rework than fixing it after the fact.

Pro Tip: Audit your chart of accounts before you audit your integrations. A clean mapping with a slow feed beats a fast feed with messy categories every time.
A step-by-step implementation roadmap for small businesses
Moving from month-end-only reporting to a live P&L works best as a sequence, not a single project. Trying to do everything at once is the most common reason implementations stall.
- Assess. Inventory every data source feeding your books today, flag the reconciliation steps that cause the most friction, and identify who on your team touches financial data and where.
- Quick wins (weeks 1 to 3). Enable bank feeds across all accounts, automate receipt capture so expenses stop arriving as a shoebox of paper, and clean up the chart of accounts identified in the assessment.
- Intermediate (weeks 4 to 10). Automate bank reconciliations, build categorization rules so recurring transactions sort themselves, and set up role-based dashboards so a sales manager sees different numbers than a finance lead.
- Advanced (ongoing). Take ownership of your finance data model rather than relying on ad-hoc exports, add alerting for anomalies like an unusual vendor charge or a margin swing, and build in an audit trail for every automated adjustment.
This layered sequence, moving from feed enablement to reconciliation automation to rule-based adjustments with human review, mirrors the approach AICPA & CIMA's frictionless finance guidance recommends: each layer reduces risk before adding the next, so a mistake in automation doesn't cascade into bad decisions downstream.
A few practical notes on effort and sequencing:
- The quick wins stage usually takes the least calendar time but delivers the most visible improvement, since bank feeds alone cut most of the manual re-entry.
- The intermediate stage is where most of the real labor savings show up, but it requires someone to actually build and test the categorization rules rather than leaving defaults in place.
- The advanced stage is never really "done." Alerting thresholds and audit trail requirements evolve as the business grows, so treat this as a standing review, not a one-time project.
- Small businesses with a single entity and straightforward revenue often move through all four stages within a quarter; multi-entity or multi-location businesses should expect each stage to take longer, particularly the chart-of-accounts cleanup.
Trying to skip to advanced automation without first fixing chart of accounts and reconciliation discipline is the single most common reason live P&L projects produce numbers nobody trusts.
Data governance and controls to make live P&L defensible
Speed without controls just means you find out about a problem faster, it does not mean the problem goes away. A defensible live P&L needs documented reconciliation and exception handling, meaning a clear process for what happens when a transaction does not match an expected category or amount, and who reviews it before it is finalized.
AI-driven categorization and anomaly detection can accelerate this work considerably, but only when it operates inside a documented control framework. AICPA & CIMA guidance on designing reporting controls is direct on this point: AI can speed up reporting, but it still needs audit-ready documentation and a human signoff before a number becomes final.
Key controls worth building into any live reporting system:
- Reconciliation cadence: daily or weekly bank reconciliations rather than a single pass at month-end.
- Exception workflows: a defined path for flagged transactions, with a named reviewer and a resolution deadline.
- Human signoff on automated adjustments: no AI-generated categorization or accrual estimate becomes part of the official record without someone checking it.
- Versioning and audit trails: every automated change is logged, so you can show exactly what changed, when, and why.
For tax purposes, the IRS requires that any electronic recordkeeping system be able to reproduce records in a legible, retrievable format on demand, and that businesses test their systems before discarding original hard copies, as outlined in IRS guidance on what records to keep. A live dashboard that cannot produce the underlying transaction detail on request is not meeting that bar, no matter how clean it looks.
When you present live numbers to leadership or investors, say plainly which figures are operational estimates and which are finalized. A confident "this is directional, final numbers close on the fifth" builds more trust than presenting an unreconciled figure as gospel.
Reporting structures and KPIs to show on live P&L dashboards
A single static P&L statement answers one question: what happened. A live dashboard should answer three: what happened, how does it compare, and where is the trend heading. That calls for three complementary views rather than one.
- Trend view: month-over-month or week-over-week movement, best for spotting a shift before it becomes a crisis.
- Comparative view: current period against budget or prior period, best for operations teams making tactical calls.
- Trailing twelve months (TTM): a rolling annual view that smooths out seasonal noise, best for strategic decisions and lender conversations.
AICPA & CIMA course materials on modern reporting structures note that executives tend to favor trend and TTM views for strategic planning, while operations teams lean on comparative, cost-center level detail for day-to-day tactics. Matching the view to the audience, rather than sending everyone the same static report, is what makes a dashboard actually get used.
Beyond revenue and net income, a handful of operational KPIs belong on every live dashboard: gross margin, contribution margin by product or service line, accounts receivable days outstanding, and cash runway in months. These four alone catch most of the problems that a monthly close would surface too late to act on.
Keep the dashboard itself simple. A screen crowded with every metric your accounting software can generate is harder to act on than one showing five numbers that map directly to decisions you actually make. A well-built quarterly business review template can help structure how these numbers get presented to stakeholders on a recurring basis, keeping the format consistent even as the underlying data refreshes continuously.
How we build reliable real-time P&L systems for clients
Our approach starts from a principle AICPA and CIMA call frictionless finance: owning your finance data model rather than depending on a patchwork of exports and manual pivots. We build that ownership directly into the systems we set up for fractional CFOs and accounting firms.
In practice, that means integrating directly with QuickBooks so transaction data flows into reporting without manual re-entry, building rule-based auto-categorization that handles recurring transactions automatically, and automating reconciliations so exceptions surface quickly instead of piling up until month-end. Every automated step passes through documented process checks and requires human signoff before it becomes part of the official record, which keeps the output audit-ready rather than just fast.
How this maps to the roadmap above:
- Quick wins and intermediate stages: structured training programs walk teams through feed setup, categorization rules, and reconciliation automation step by step.
- Advanced stage: custom build engagements help firms that need a finance data model tailored to multiple entities or complex revenue structures.
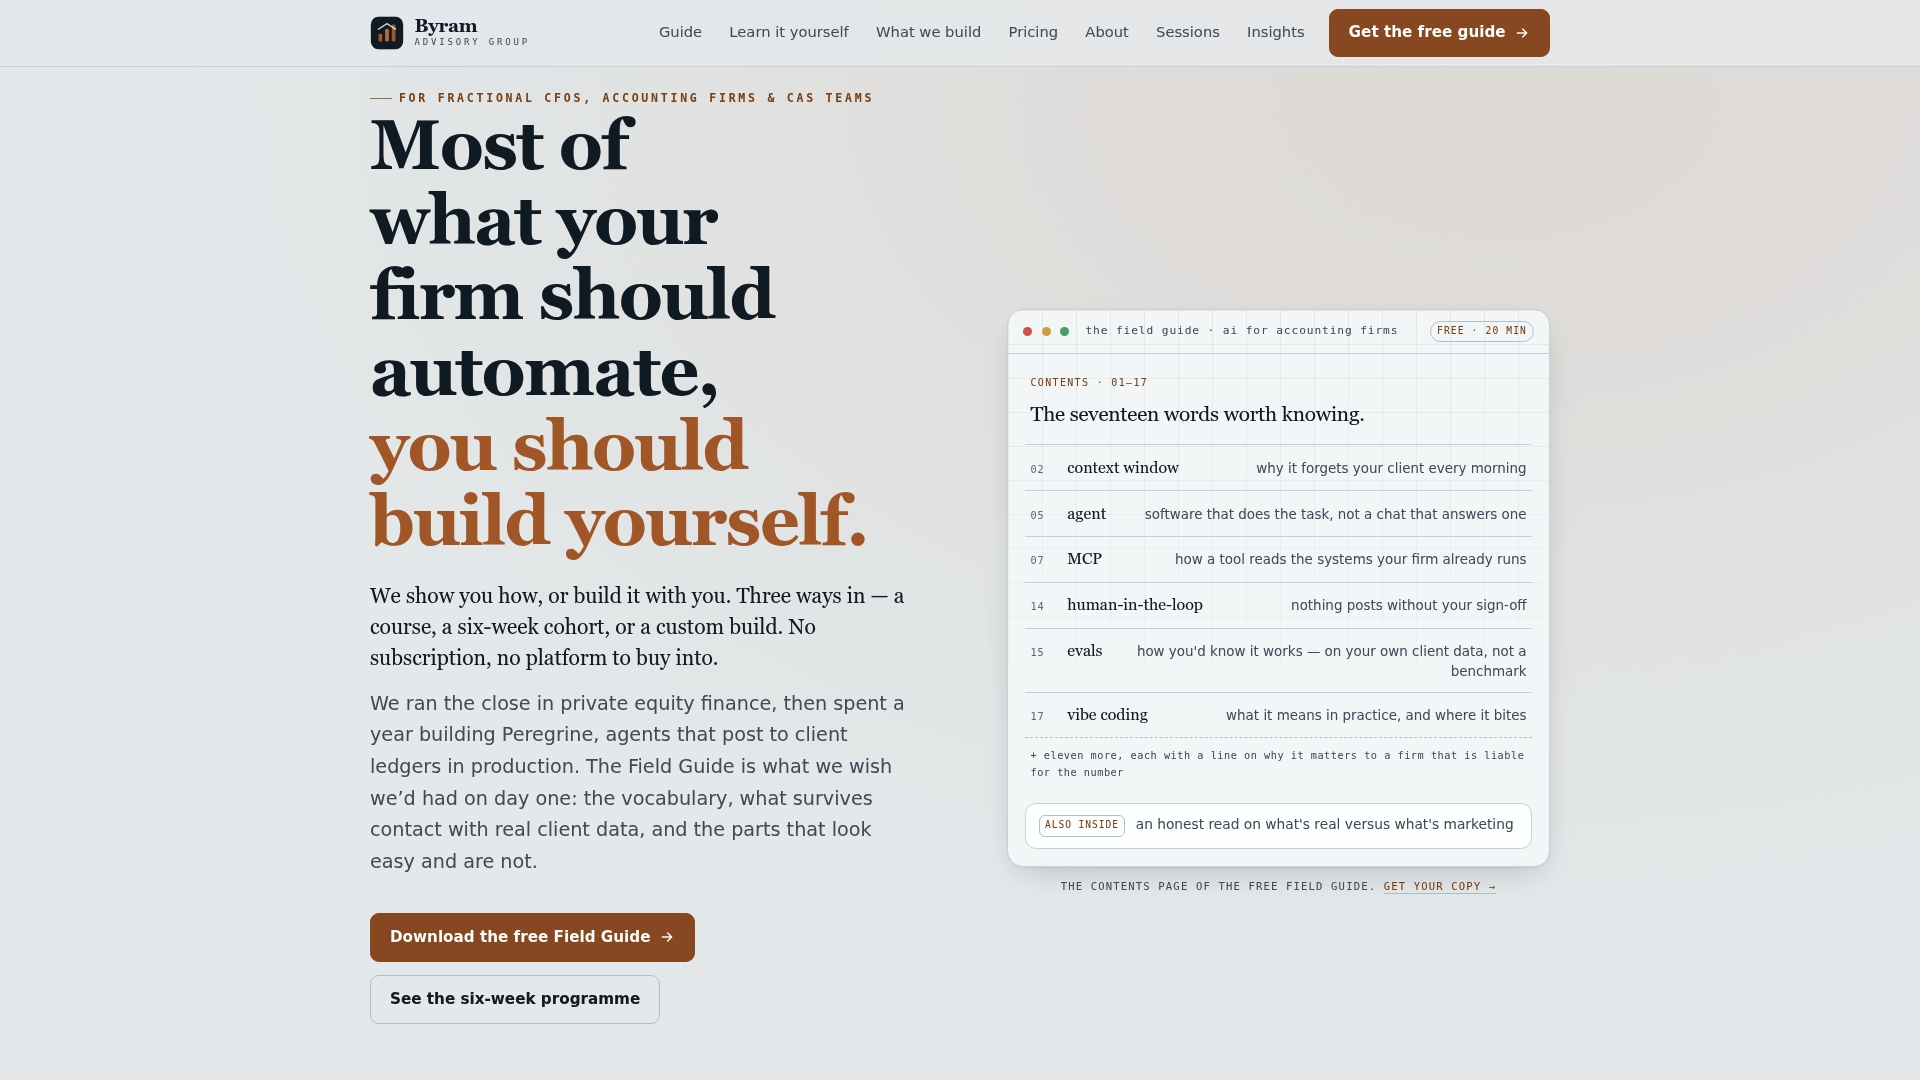
- Self-paced learning: the Field Guide to AI for Accounting Firms covers the same governance principles in a format teams can work through on their own schedule.
Pro Tip: Before automating a reconciliation step, document the manual process exactly as it happens today. That written baseline is what makes the automated version auditable later.
When to invest in live P&L and traps to avoid
The right moment to move to live reporting is when month-end surprises start costing you real decisions, not just real time. If you have caught yourself making a hiring or pricing call on numbers you already suspected were stale, that is the signal.
The biggest trap is treating automation as a substitute for reconciliation discipline rather than an accelerant for it. Automated categorization rules drift over time as new vendors and transaction types appear, and a dashboard built on uncorrected drift looks confident while being quietly wrong. The second trap is skipping the chart-of-accounts cleanup because it feels like administrative overhead rather than real progress. It is the single highest-leverage step in the entire project.
After deployment, check two things within the first month: how often exceptions get flagged and resolved on schedule, and whether your month-end close actually gets faster. If neither improves, the automation is running but the governance behind it is not.
— Owen
How Byram Advisory can help you get there
If you have read this far and recognize your own business in the pitfalls above, the path forward depends on how much you want to build yourself versus hand off. We offer a few different entry points depending on where you are.
For a fast, hands-on build without a long engagement, The Sprint is a one-off $2,000 project built to get core automation and reporting in place quickly. For teams that want their own people trained to run and maintain the system long-term, The Bootcamp is a cohort-based program focused on implementation skills rather than theory. And for firms with more complex entity structures or integration needs, our custom build and advisory services cover everything from a close process teardown to a fully tailored platform build.
Here is a quick way to self-select:
- Want it built fast, with minimal internal lift: start with The Sprint.
- Want your team to own the process going forward: start with The Bootcamp.
- Have multiple entities or a nonstandard revenue model: reach out about a custom build.
Clients keep the code and process documentation we deliver, so the system keeps running independently of us once the engagement ends. If you are not sure which fits, our Field Guide to AI for Accounting Firms is a free starting point before you commit to anything.
This article is general information, not a substitute for advice from a qualified financial advisor. Consult a qualified financial professional about your own circumstances before acting on anything here.
FAQ
What is an income loss statement?
An income loss statement, more commonly called a profit and loss statement or P&L, lists revenue, expenses, and the resulting net profit or loss over a given period. It is one of the core financial statements businesses use alongside the balance sheet and cash flow statement.
How do I display a profit and loss account?
A P&L is typically displayed top to bottom: revenue first, then cost of goods sold to show gross margin, then operating expenses to show operating income, and finally taxes and other adjustments to reach net income. Live dashboards often add trend, comparative, and trailing twelve month views alongside this standard layout so stakeholders can see direction, not just a single period's result.
What are common P&L account mistakes?
The most common mistakes are inconsistent categorization across entities or time periods, missing accrual adjustments that distort a given month's results, and treating one-time items as recurring revenue or expense. Poor reconciliation discipline compounds all three, since errors that go uncaught at the transaction level eventually show up as a misleading trend.
Is a P&L the same as a financial statement?
A P&L is one type of financial statement, not a synonym for the whole set. The complete picture generally includes the P&L, the balance sheet, and the cash flow statement, each answering a different question about the business's financial position.
Sources
- Driving data to value with frictionless finance (AICPA & CIMA)
- What kind of records should I keep (IRS)