

A standardized chart of accounts is a consistent, numbered list of ledger accounts you set up before recording a single transaction. It groups every asset, liability, revenue, and expense into a predictable structure, which makes tax mapping faster, period close cleaner, and automation possible. The first move is simple: pick a numbering convention and map it to your tax and reporting categories before you touch the books.
TL;DR:
- A standardized chart of accounts should use five-digit numbering with spaced blocks to allow for growth and avoid renumbering as your business expands.
- Mapping each account to specific tax lines and management reports from the start simplifies compliance and reduces the need for later reclassification.
- Regular review and maintenance, including halving accounts with low activity and adjusting for structural changes, are essential for data integrity over time.
- Automation tools can enforce consistency, flag mis-coded transactions, and ensure the chart stays standardized despite staff turnover or increasing transaction volume.
- Small businesses typically need between 30 to 40 active accounts, with industry-specific adjustments, avoiding unnecessary complexity that hampers analysis and reporting.
Table of Contents
- What Is a Standardized Chart of Accounts, and Why Does It Matter?
- What Are the Standard Numbering Conventions for a Chart of Accounts?
- How Do You Set Up a Standardized Chart of Accounts?
- What Does a Standardized COA Look Like for a Small Business?
- How Do You Maintain and Govern a Chart of Accounts Over Time?
- What Are the Most Common Chart of Accounts Mistakes?
- How Does Automation Protect a Standardized Chart of Accounts?
- How Does the Chart of Accounts Map to Your Tax Return?
- Do Different Industries Need Different Chart of Accounts Structures?
- How Do IFRS and GAAP Considerations Affect Your Chart of Accounts?
- How Should Your Chart of Accounts Change as the Business Grows?
- How Does a Standardized COA Improve Financial Analysis and Reporting?
- Author Perspective: Prioritized Next Steps and Quick Wins
- How Byram Advisory Helps You Standardize and Automate Your Chart of Accounts
- Sources
What Is a Standardized Chart of Accounts, and Why Does It Matter?
Every transaction your business records lands somewhere in the general ledger, and the chart of accounts is the map that tells your bookkeeping software where that "somewhere" is. Without it, the ledger is just a pile of numbers with no home. A standardized chart of accounts gives every asset, liability, equity line, revenue stream, and expense category a fixed code and a fixed name, so the same transaction always gets classified the same way, no matter who enters it.
That consistency sounds small until you try to close your books without it. Standardizing accounts pays off in three concrete ways:
- Consistent reporting. Month over month and year over year, your profit and loss statement and balance sheet compare apples to apples instead of shifting categories every quarter.
- Cleaner tax prep. When accounts map directly to tax return lines, your accountant spends less time reclassifying and more time reviewing.
- Faster close and smoother audits. A predictable structure means less time hunting for where a transaction landed, and external reviewers can trace activity without asking twenty follow-up questions.
Establishing a standardized structure is also the difference between a chart of accounts that works and one that quietly causes data integrity problems for years. According to APQC's guidance on maintaining a standardized COA, the setup process should include industry-specific adjustments, mapping to tax-deductible categories, and assigning unique account codes before you import the list into your accounting software and start recording activity.
Ownership matters here too. In a small business, the owner or bookkeeper often builds the first version, but once you bring in a fractional CFO, controller, or outside accounting firm, that person should take ownership of the structure going forward. The right time to standardize is before your transaction volume grows past the point where fixing mistakes becomes expensive. If you are already three years into sloppy categorization, the fix is a one-time cleanup project. If you are just starting, you can build it right the first time and skip that pain entirely.
What Are the Standard Numbering Conventions for a Chart of Accounts?
Most accounting frameworks group accounts by type using numeric ranges, and the ranges are close to universal across industries. APQC's numbering research lays out the convention most accounting software and standard frameworks follow, using either four or five digits depending on how much detail you need.
| Range | Account type | Typical use |
|---|---|---|
| 1000s | Assets | Cash, accounts receivable, inventory, fixed assets |
| 2000s | Liabilities | Accounts payable, credit cards, loans, accrued expenses |
| 3000s | Equity | Owner's equity, retained earnings, capital contributions |
| 4000s | Revenue | Sales income, service income, other operating revenue |
| 5000s | Cost of goods sold | Direct materials, direct labor, production overhead |
| 6000s | Operating expenses | Payroll, rent, marketing, software, professional fees |
Four-digit systems work fine for a single-location service business with a short list of accounts. Once you add multiple locations, multiple entities, or a product line with real cost of goods sold detail, four digits run out of room fast. A five-digit system, say 10100 instead of 1000, leaves space to insert new accounts later without renumbering everything you already built. APQC's research specifically flags five-digit structures as the better choice for businesses expecting growth, because you can slot a new sub-account into a gap instead of disrupting the whole sequence.
Block numbering is the practical trick behind this. Instead of numbering assets 1000 through 1010 back to back, leave gaps: 1000 for cash, 1010 for the next cash-related account, 1100 for accounts receivable, 1200 for inventory. That spacing gives you room to add "Cash, Savings" or "Cash, Payroll Account" later without renumbering your whole chart. The same logic applies to splitting current assets (cash, receivables, short-term investments) from fixed assets (equipment, vehicles, buildings) into separate sub-ranges within the 1000s, so your balance sheet groups them correctly without extra manual work.
Pro Tip: Reserve at least ten numbers between every account you create in a given category, even if you only need one account today. It costs nothing now and saves you a renumbering project in two years.
How Do You Set Up a Standardized Chart of Accounts?
Building the structure is the easy part. Getting it into your accounting software without breaking historical data or confusing your bookkeeper takes a sequence, not a rush job.
Before you touch any software, get three things settled: who needs to sign off on the final structure (usually the owner plus whoever prepares taxes), what your tax reporting categories actually require, and what management reports you want to pull on a recurring basis. Skipping this step is the single most common reason a COA needs a rebuild within a year.
Once that groundwork is done, follow this sequence:
- Audit your existing accounts. Export your current chart, or if you're starting fresh, list every type of transaction your business generates. Flag duplicates, catch-all accounts, and anything unused in the past twelve months.
- Design your numbering structure. Pick four or five digits, assign your ranges (1000s assets, 2000s liabilities, and so on), and leave gaps for future growth.
- Map every account to a tax or reporting line. This is the step people skip and regret. Each expense account should tie to a line on your tax return or a category your accountant already uses.
- Build the import file. Most platforms accept a CSV or Excel template with account number, account name, account type, and a parent account column for sub-accounts.
- Test in a sandbox or backup company file first. Never import a new chart of accounts directly into your live file. Most platforms let you create a test company or duplicate file for exactly this reason.
- Import and reconcile. Once the test import looks right, import into the live file, then run a trial balance to confirm nothing landed in the wrong bucket.
If you're working in QuickBooks or a comparable platform, a few practical details matter more than they should. The software enforces a fixed set of account types (asset, liability, equity, income, expense), so your custom numbering has to work within those categories rather than around them. Setup guidance for small business platforms recommends renaming every default account to match your new numbering convention before you import a single transaction, because reclassifying transactions after the fact takes far longer than fixing account names up front. Sub-accounts should nest logically under a parent, for example 6010 "Advertising, Digital" and 6020 "Advertising, Print" both rolling up under 6000 "Marketing," so your summary reports stay clean even when the detail reports get granular.
Document every change as you go. A simple change log, even a shared spreadsheet with date, account changed, reason, and who approved it, saves you from the "why does this account exist" conversation eighteen months from now.
Pro Tip: Run your first full month after import side by side with the old system's numbers. If your net income doesn't match within a rounding error, something got misclassified during the transition, and it's far easier to catch in week one than in month six.
What Does a Standardized COA Look Like for a Small Business?
Templates help more than blank-page advice ever will. Here's how the structure shifts depending on what kind of business you run.
A service firm (consulting, agencies, professional services) typically needs 30 to 40 active accounts. A workable skeleton looks like: 1000 Checking, 1200 Accounts Receivable, 1500 Equipment, 2000 Accounts Payable, 2100 Credit Card Payable, 3000 Owner's Equity, 4000 Service Revenue, 6000 Payroll Expense, 6100 Rent, 6200 Software Subscriptions, 6300 Professional Fees, 6400 Marketing. That's roughly fifteen accounts to start, with room to expand as revenue streams diversify.
A retail or product business needs more detail on the cost side. Beyond the service firm skeleton, add 1300 Inventory, 5000 Cost of Goods Sold, 5100 Freight In, 5200 Merchant Processing Fees, and separate revenue lines like 4000 Product Sales and 4100 Shipping Income. Inventory controls live or die on this level of detail. If you lump all cost of goods sold into one account, you lose the ability to see whether shipping costs or merchant fees are quietly eating your margin.
A nonprofit runs on a different logic entirely, because funders and Form 990 filings care about how money splits across program services, fundraising, and administration. A nonprofit COA typically separates 4000 Program Revenue, 4100 Contributions, 4200 Grant Revenue on the income side, then splits every expense category into three parallel versions: program, fundraising, and management/general. That triples your expense accounts compared to a for-profit structure of similar size, but it's the only way to produce the functional expense breakdown your Form 990 and most grant reports require.
Across all three types, the practical ceiling matters more than people expect. Research on small-business setups found that most small businesses run well with 30 to 40 active accounts, even though the default install in many accounting platforms ships with 70 to 80 accounts already loaded. Delete or deactivate what you don't use. A chart with 80 accounts and 15 that ever get touched isn't detailed, it's just cluttered.
How Do You Maintain and Govern a Chart of Accounts Over Time?
A chart of accounts isn't a one-time setup task. Treat it as a living structure that needs a checkup on a schedule, not just when something breaks.
Review it at least once a year, and add an extra review any time something structural changes, a new product line, an acquisition, a new state you're operating in, or a shift from services to a hybrid product model. APQC's research on COA governance frames this directly: a haphazard chart of accounts causes frustration and inaccuracies over time, and the fix is treating it as a living tool that gets periodic review and consolidation rather than something you set once and forget.
A few governance habits keep drift from creeping in:
- Pull a transaction count by account once a quarter. Anything with fewer than a handful of transactions in the past year is a candidate for merging into a broader category.
- Before merging two accounts, confirm neither feeds a tax line or a covenant calculation that needs the detail preserved.
- Keep a one-page change log: what changed, why, who approved it, and the effective date.
- Train new hires on the numbering logic during onboarding, not just "here's the chart, figure it out."
Pro Tip: When you merge a low-use account into a broader one, don't delete the old account number outright. Mark it inactive instead, so historical reports that reference it still resolve correctly.
Automation can enforce a lot of this without manual policing, flagging a transaction that lands in an account with no recent activity, or catching a new vendor that got coded to a personal catch-all instead of an existing category. That kind of validation is where the governance conversation starts to overlap with tooling, which we'll get into later in this piece.
What Are the Most Common Chart of Accounts Mistakes?
Three mistakes show up in almost every messy chart of accounts, and all three are fixable without starting over.
- Catch-all accounts swallow detail you'll need later. "Miscellaneous" or a bloated "Marketing" account that absorbs everything from software subscriptions to client gifts feels convenient in the moment. It becomes a problem the first time you need to know what you actually spent on paid ads versus swag. Split catch-alls into two or three specific accounts the moment you notice the balance climbing without a clear story behind it.
- Near-duplicate accounts fragment your data. "Office Supplies" and "Office Expense" sitting side by side usually means someone created a new account instead of asking what already existed. If an account has fewer transactions than a comparable one covering the same thing, merge them and keep the more active account's number.
- Weak tax mapping creates year-end scrambles. Every expense account should tie to a specific line on your tax return before you file, not after. Run a mapping check each year: pull your chart, match each account to its tax line, and flag anything unmapped.
When you correct a past misclassification, move the transaction with a journal entry rather than editing the original transaction directly. That preserves the audit trail so a reviewer can see both what happened and what you corrected.
How Does Automation Protect a Standardized Chart of Accounts?
A chart of accounts only stays standardized if something enforces the rules after the initial setup, and that's usually where manual processes break down. Someone creates a new vendor, codes it to the wrong account under deadline pressure, and nobody notices until the account has forty miscoded transactions sitting in it.
Automation closes that gap in a few specific ways:
- Import validation catches a transaction trying to post to an account type it doesn't belong in before it ever hits the ledger.
- Recurring mapping rules apply the same categorization to a repeat vendor or transaction type every time, instead of relying on whoever happens to be doing data entry that week.
- Real-time dashboards flag accounts with unusual activity spikes or accounts that have gone quiet, both signals worth a second look.
Byram-advisory's platform, Peregrine, builds this kind of validation directly into the QuickBooks workflow for fractional CFOs and accounting teams, catching orphaned accounts and mis-coded transactions before they turn into a reconciliation headache at close. If you're evaluating automation for your own firm, look for a tool that validates account type on import, applies consistent rules to recurring transactions, and gives you a real-time view of anomalies rather than a report you only see after the damage is done.
How Does the Chart of Accounts Map to Your Tax Return?
Every account you create eventually has to answer to a tax form, and the businesses that build tax mapping into the chart of accounts from day one spend far less time reconciling at filing season.
If you're a sole proprietor, your expense accounts should roughly mirror the categories on Schedule C: advertising, car and truck expenses, contract labor, insurance, legal and professional fees, office expense, rent, supplies, travel, and utilities. Naming your accounts close to these exact terms, "Legal and Professional Fees" instead of a vague "Consulting," saves your preparer from asking what a transaction actually was.
Corporate returns work the same way in principle, just with more categories. A C-corp or S-corp return groups cost of goods sold, compensation of officers, salaries and wages, repairs and maintenance, bad debts, rents, taxes and licenses, and depreciation into distinct lines, and each of those should have a clear home in your 5000s and 6000s ranges. If your chart lumps "salaries" and "officer compensation" into one account, you're forcing your accountant to manually split it every year, a task that's trivial to avoid by separating them from the start.
The practical move is to build a one-page mapping document alongside your chart of accounts: account number, account name, and the exact tax line it feeds. Update it any time you add an account. This turns tax prep from an archaeology project into a fifteen-minute review.
Do Different Industries Need Different Chart of Accounts Structures?
The core numbering ranges stay consistent across industries, but the accounts that live inside those ranges shift a lot depending on what the business actually does.
A manufacturing business needs a heavier cost of goods sold section than a typical service firm, often splitting 5000 Raw Materials, 5100 Direct Labor, 5200 Manufacturing Overhead, and 5300 Freight In as distinct accounts rather than one lump "Cost of Goods Sold" line. Without that breakdown, you can't tell whether a margin problem comes from rising material costs or inefficient labor.
A retail operation, as covered in the templates section, leans on inventory and merchant processing detail, since those two categories usually drive the biggest swings in gross margin from month to month.
A nonprofit structure, again building on the earlier example, needs its expense accounts split three ways across program, fundraising, and management categories to satisfy Form 990 reporting and funder expectations. That functional split is arguably the single biggest structural difference between a nonprofit chart of accounts and a for-profit one, more consequential than any numbering convention choice.
The lesson across all three: start from the standard numbering framework, then customize the account names and sub-accounts inside each range to match what your specific business needs to track. Copying a generic template without industry adjustments is how businesses end up with a chart that technically works but never answers the questions they actually have.
How Do IFRS and GAAP Considerations Affect Your Chart of Accounts?
Most small businesses in the United States operate under GAAP rather than IFRS, but the underlying logic both frameworks use for grouping accounts is worth understanding even if you never file an IFRS-based statement.
The IFRS Conceptual Framework addresses what it calls the unit of account, essentially the question of how granular a single line item should be before it stops adding useful information and starts adding noise. That question applies directly to chart of accounts design. Should "Software Subscriptions" be one account or five, split by vendor? The IFRS framework's aggregation guidance argues for grouping items that share economic characteristics and separating items that behave differently enough to matter for decision-making, which is a useful filter to apply to your own account list.
Publicly available GAAP-style example charts give you a compatible starting structure if you want a framework-aligned template rather than building from scratch. If your business ever expects outside investment, a merger, or international operations, building your chart with this aggregation logic in mind from the start avoids a painful restructuring later, since investors and auditors used to IFRS or GAAP-consistent reporting expect a certain baseline level of account granularity.
How Should Your Chart of Accounts Change as the Business Grows?
The chart of accounts that works for a two-person startup will not work for the same business at twenty employees, and trying to force it to is where most of the pain in a later cleanup project comes from.
The best practice is building in expansion room from day one rather than reacting after growth outpaces the structure. That's the real argument for five-digit numbering and block gaps covered earlier: they let you add new revenue streams, new departments, or new locations as sub-accounts under an existing range instead of renumbering the whole chart.
Customization should track actual business changes, not urges to add detail for its own sake. Adding a new product line justifies a new revenue account. Adding a new manager who wants their own report doesn't necessarily justify five new expense accounts if the existing ones already capture what's needed with a class or location tag instead. Most accounting platforms let you tag transactions by department, location, or class without creating an entirely new account, which is almost always the better move for scaling detail without bloating the chart itself.
The businesses that scale cleanest are the ones that resist the urge to add an account for every new question that comes up, and instead ask whether a tag, a sub-account, or a report filter solves the same problem with less structural cost.
How Does a Standardized COA Improve Financial Analysis and Reporting?
The payoff for all this structure shows up the moment you try to actually use your financial data instead of just record it. A standardized chart of accounts is what makes trend analysis, budgeting, and management reporting reliable instead of guesswork.
When your revenue and expense categories stay consistent month over month, you can actually trust a variance report. If "Marketing" meant one set of expenses in January and a different set in June because someone reclassified things mid-year, your trend line is lying to you. Consistency is what makes a five-year comparison, a budget-to-actual report, or a cash flow forecast mean anything at all.
It also determines how fast you can close. A clean, standardized structure means less time spent asking "where does this transaction go" and more time spent reviewing the numbers that matter. For a fractional CFO managing multiple client entities, that consistency compounds. The same numbering logic across every client account means faster onboarding, faster close, and reports that management can actually compare across the portfolio instead of relearning a new structure for every client.
Author Perspective: Prioritized Next Steps and Quick Wins
If you take one thing from this, make it the sequencing. Choose your numbering convention first, map every account to a tax line second, and only then build the import file and test it in a sandbox. Skipping the tax mapping step is the mistake that costs people the most time later.
Resist the urge to build a chart with fifty accounts because you might need the detail someday. A chart with thirty accounts that everyone actually uses correctly beats a chart with eighty accounts that nobody maps consistently. Get sign off from whoever owns the books, and budget an hour to walk your team through the new structure before you go live. That hour saves weeks of miscoded transactions.
— Owen
How Byram Advisory Helps You Standardize and Automate Your Chart of Accounts
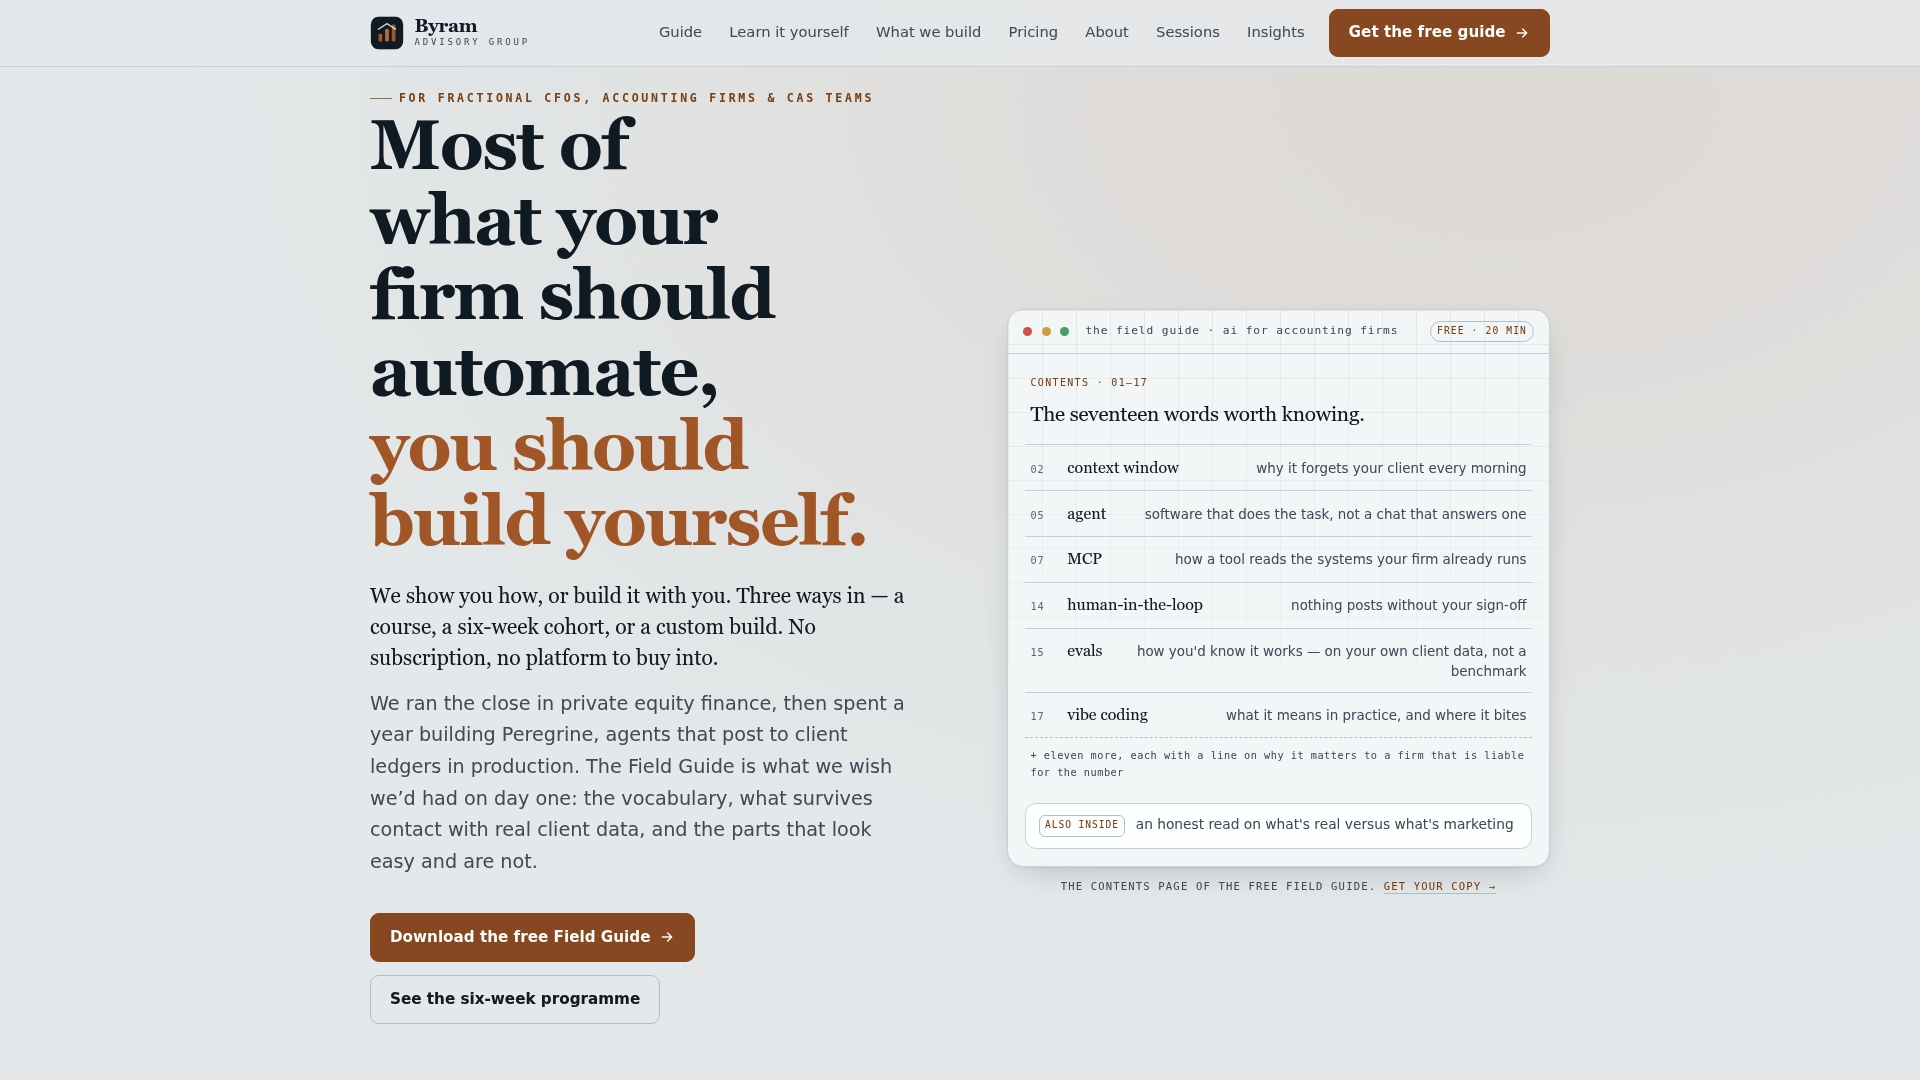
Byram-advisory built its Peregrine platform specifically for fractional CFOs and accounting teams who need their chart of accounts to hold up under real scrutiny, not just look organized on the surface.
Once your accounts are mapped and imported, the harder part is keeping them clean as transaction volume grows and staff turns over. Some platforms integrate directly with QuickBooks to flag mis-coded transactions, catch orphaned accounts before they distort your reports, and give you a real-time view of cash flow instead of a picture that's a month stale. That kind of ongoing validation is what turns a standardized chart of accounts from a one-time project into a structure that actually stays standardized.
If you want to see the reasoning behind this approach before committing to anything, download Byram-advisory's free Field Guide, which walks through how automation supports data integrity for accounting teams managing multiple client entities. If you'd rather build the skills yourself, the DIY implementation course covers hands-on setup for firms that want to own the process internally. Either way, the practical next step is the same one covered throughout this piece: get your structure right, then put something in place to keep it that way.
Sources
The frameworks and templates referenced throughout this piece are worth bookmarking directly:
- Building and maintaining standardized chart of accounts — APQC
- Conceptual Framework for Financial Reporting — IFRS